Key Performance Indicators
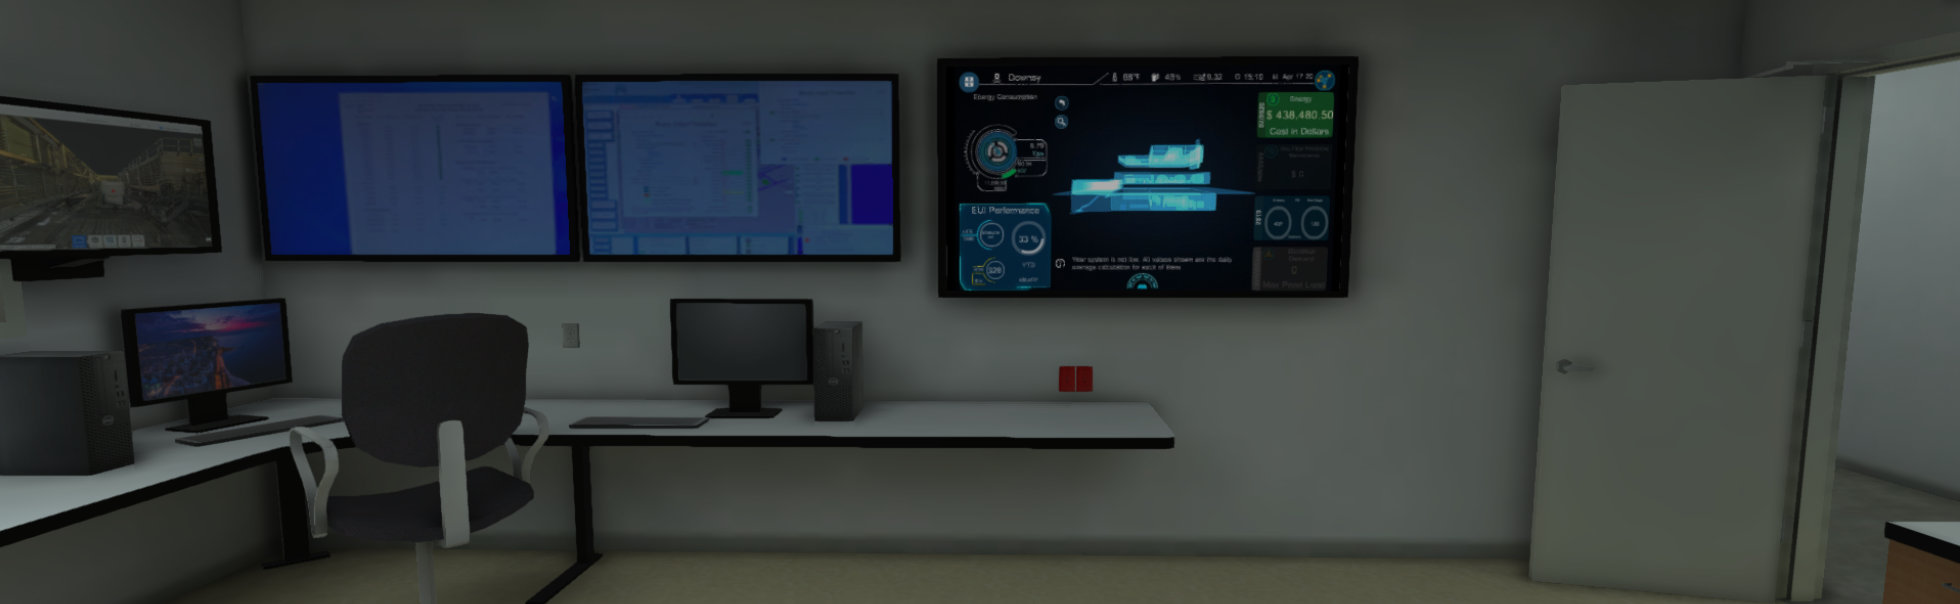
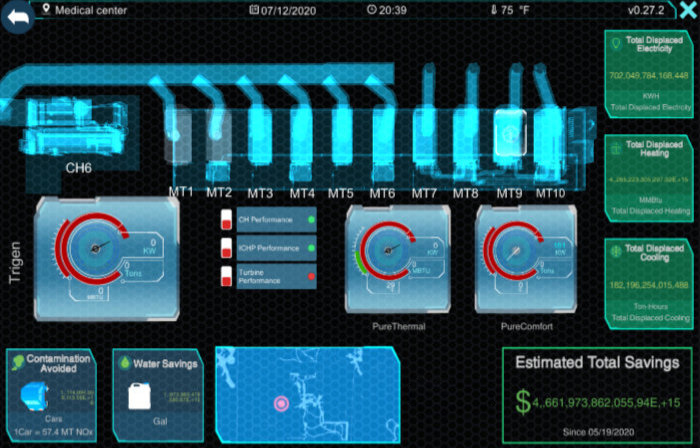
3DVES has developed an energy dashboard that uses state-of-the-art reporting to monitor energy KPIs in real-time with the help of an interactive interface.

Real-time Monitoring
Our dashboards help users to react to fast-changing market demands, analyze and optimize production costs as well as to increase their overall profitability in the long-run.
Dashboard Gathering
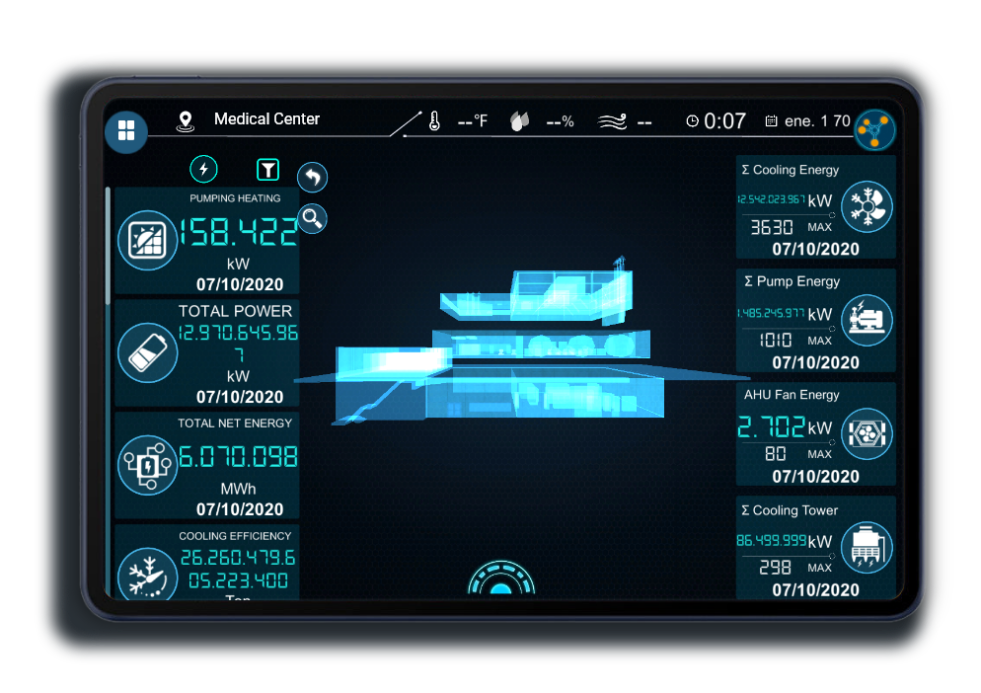
One of the main objectives of a dashboard is to gather and consolidate large volumes of data, and present changes as they happen. The dashboard gathers multiple data sources, including Utility billing, local databases, Meter, Mobile, BMS, ERP, loT, etc. Users can immediately see a detailed overview of their business in one quick glance, reducing the amount of time it takes to compile reports.
3DVES dashboard designers work closely with you, to ensure universal understanding and accessibility by all users. Our state-of-the-art dashboards provide all of your users with on-demand access to your most important metrics. |
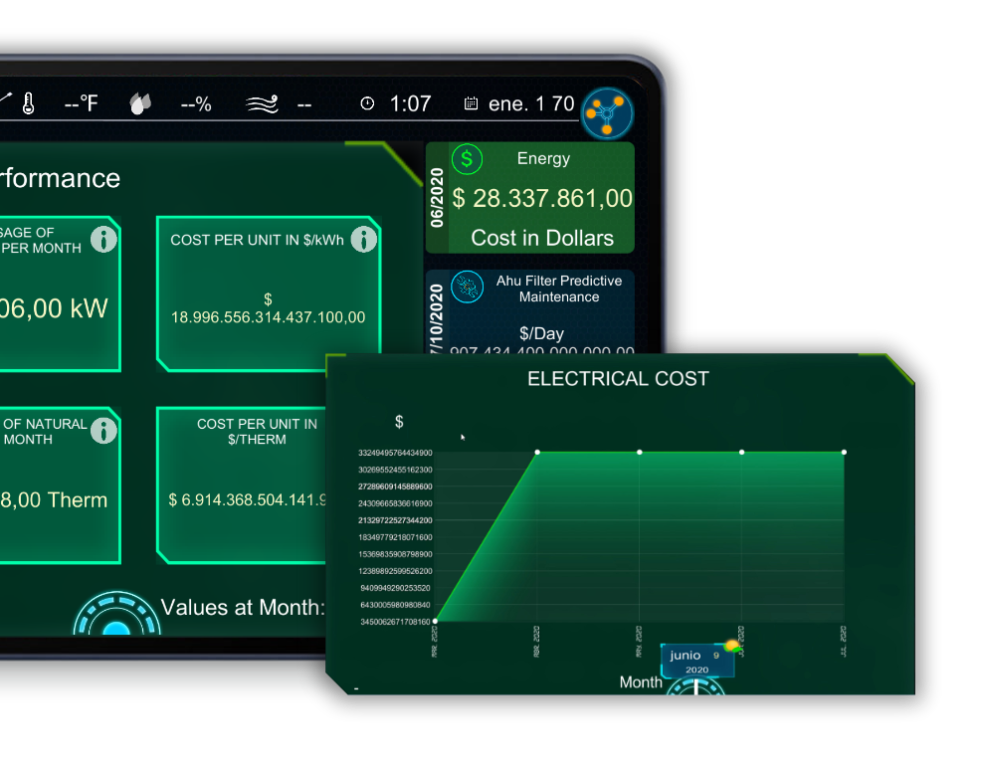
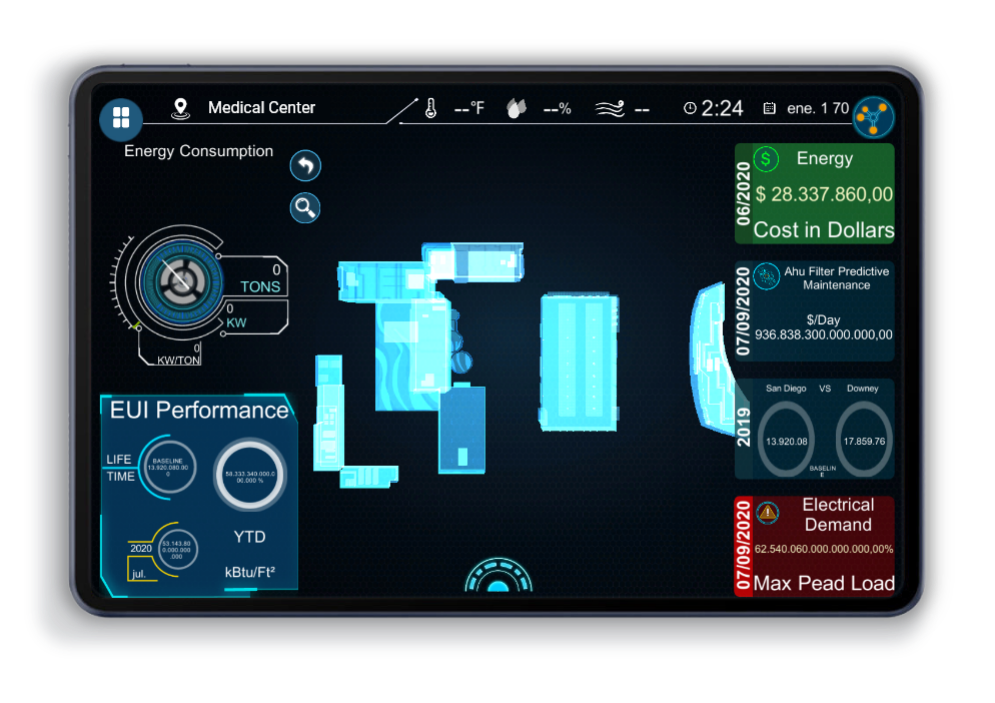
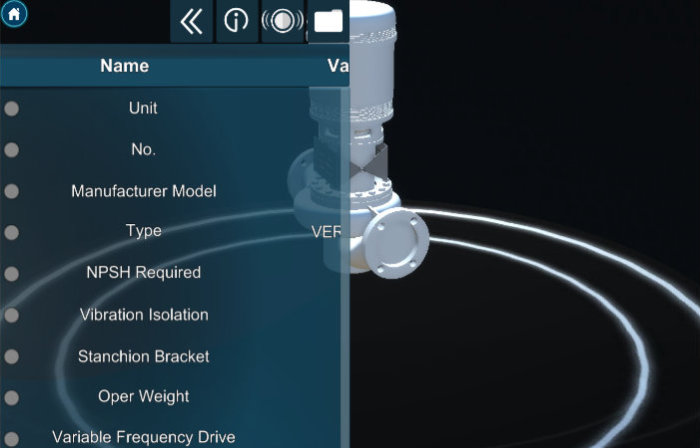
Our dashboards give you eyes on your equipment, systems, sub-systems, and overall performance, with the ability to drill down to see each component as well. 3DVES dashboards provide a solid starting point and support for making decisions, which is one of the biggest benefits of dashboards. |
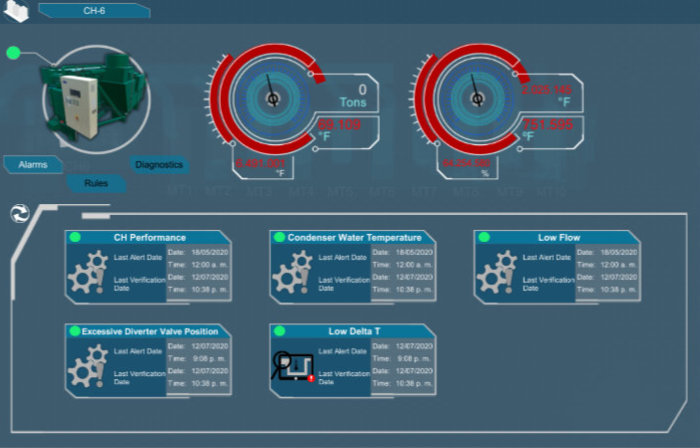
We move our clients from a static information system to a dynamic experience. This interactivity gives users the ability to filter data, predict system or equipment failures, and improve maintenance tasks. |